Two tables were published within eight days of each other this month. One is measured in percentages and one in pounds, and they describe the same country splitting in the same direction.
On Friday, an estimated 22,904 households were expected to move home, the busiest moving day of 2026 and close to four times the ordinary daily rate, according to analysis of more than 750,000 removal quotes. In the same month, Rightmove's August House Price Index recorded the largest August fall in new seller asking prices since 2018.
Both things are true. The country moved house in record numbers during the month the index says pricing got hardest. If you run an agency, that is the shape of the market you are selling into this autumn, and the national average is the worst possible lens for it.
The largest August fall in eight years
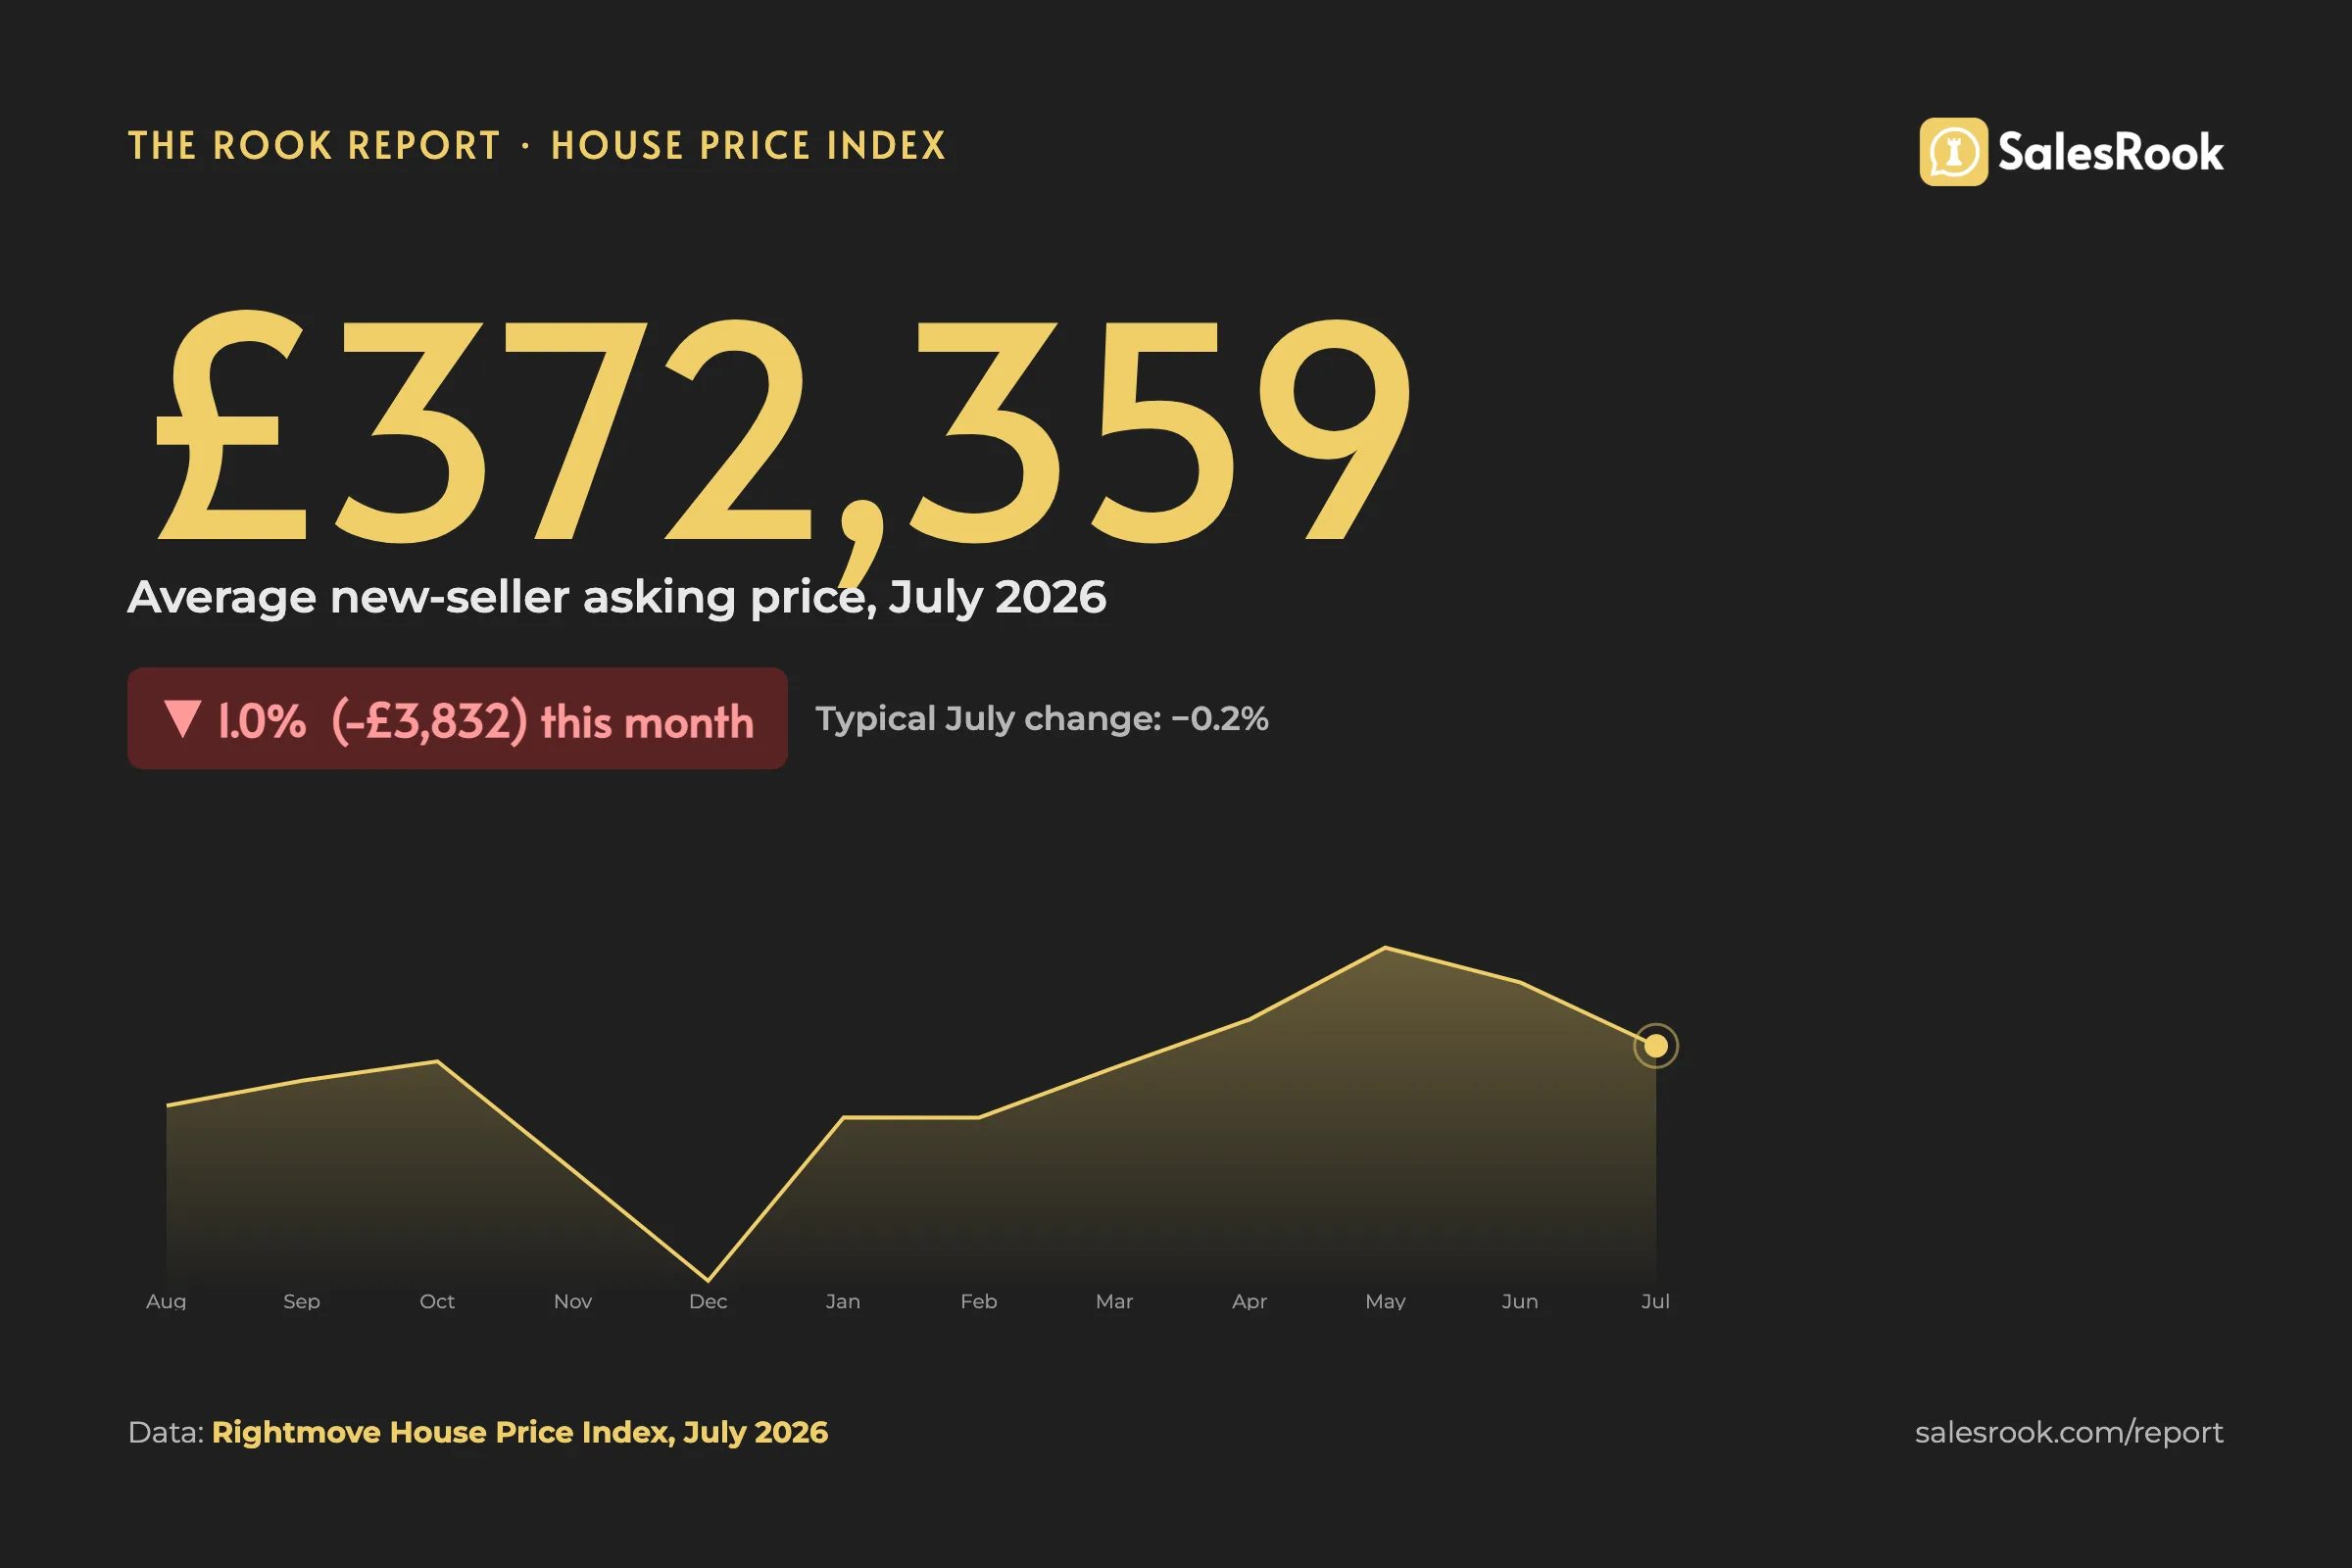
The average asking price of a newly listed home fell 2.0% this month, down £7,360 to £364,999. August is normally a soft month and prices normally drift. The ten-year average for August is a fall of 1.3%, so this is half as much again as a typical August, and the steepest August drop Rightmove has recorded since 2018.
Annually, average asking prices are now 1.0% below where they stood a year ago, the largest annual fall since December 2023. Rightmove measured 101,305 asking prices between 12 July and 8 August to arrive at those numbers, so this is a large sample of what sellers are actually asking, not a forecast of what buyers will pay.
That distinction matters more than usual right now. An asking price is a seller's opening position. A 2.0% fall in asking prices is not the market losing 2.0% of its value in four weeks. It is sellers, in large numbers, deciding to open lower than they would have in June. In dropping from July's £372,359, the average new listing gave up more ground in a month than it had in the previous three.
One thing you will not find here, because it is not in the release: there is no August figure for days to find a buyer, and none for homes per agent. Rightmove's activity charts stop at July this month. Our July issue carried both. This one cannot, and we would rather say so than estimate them.
And two other indices say the opposite
Before you take that 1.0% annual fall to a valuation, it is worth knowing that Rightmove is the outlier this month. Lloyds put prices 0.1% higher than a year ago on 10 August. Zoopla put growth at 0.9% on 27 August. Rightmove says minus 1.0%.
They are not contradicting each other so much as measuring different moments. Rightmove records what sellers ask on brand-new listings. Lloyds records mortgage approvals and Zoopla records agreed prices across the whole stock, both closer to what buyers actually pay. So the honest reading is not "prices fell 2%". It is that seller expectations moved sharply this month while achieved prices did not. That gap is the story, and it is the one you can act on.
Choice is the story, not the price
The reason sellers moved is sitting in the same release. Buyers currently have the widest choice of homes for sale at this time of year in more than a decade. In London the number of available homes is the highest in sixteen years.
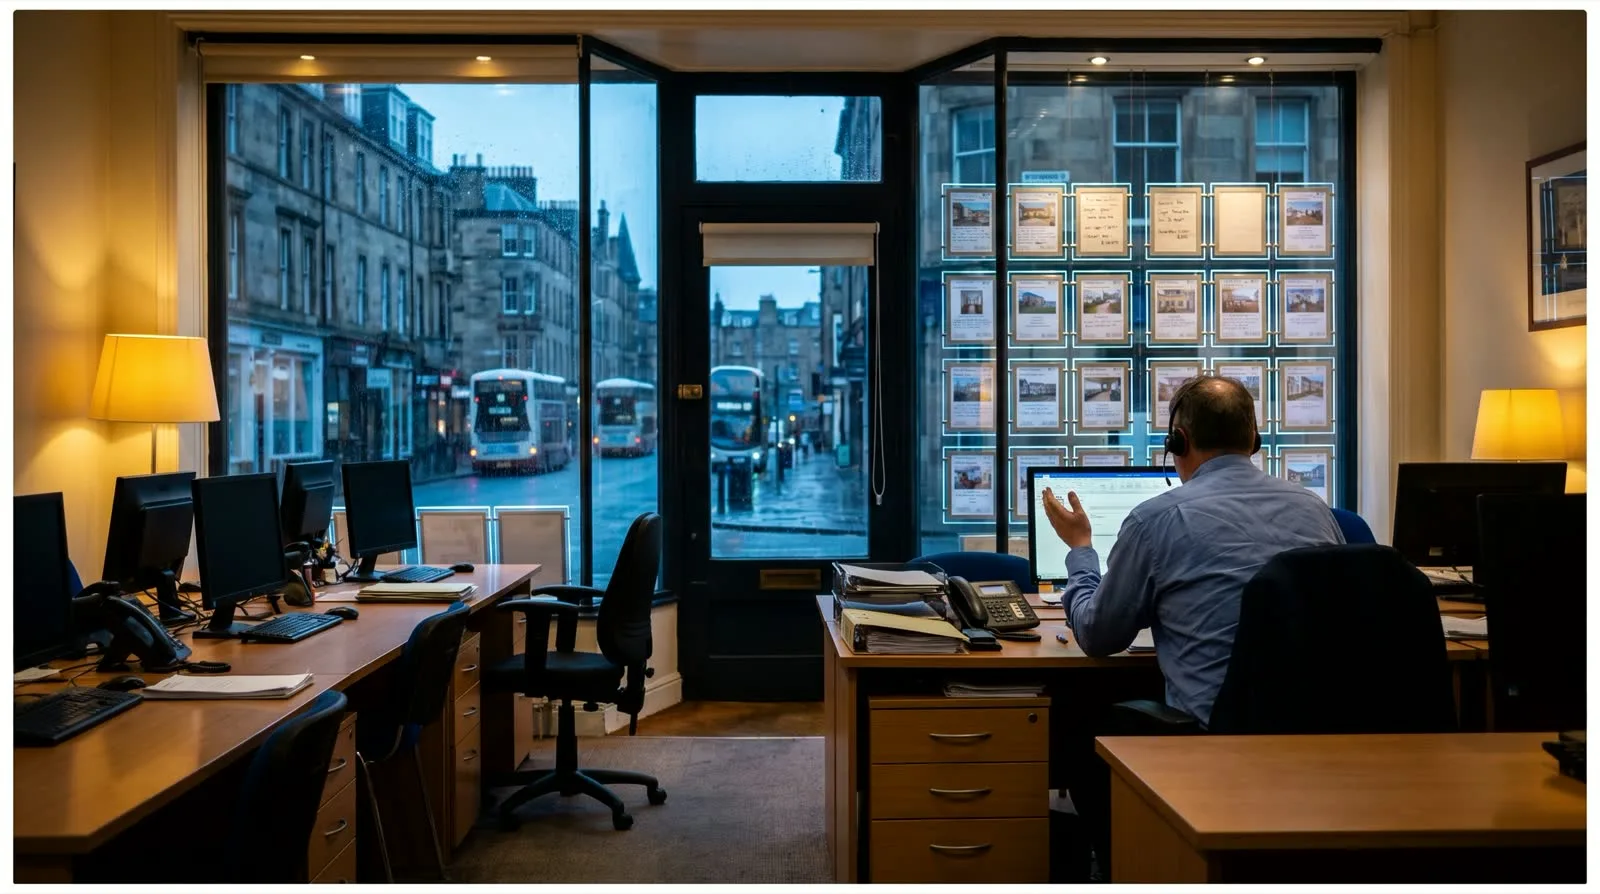
The number that should change how you work is buried further down the release. When buyers had little to choose from, a slow reply cost you a place in the queue. With this much stock on the market, it costs you the enquiry outright, because the applicant has other homes to see and no reason to wait for you.
Follow that through to the part that touches your vendors. Every enquiry you are slow to answer is a viewing one of your sellers does not get, and in a market with this much choice a vendor with no viewings does not wait long before asking another agent why. A meaningful share of those evening enquirers also have a home of their own to sell.
And the record choice is not what it looks like. New listings this year are running at 1.198 million, 0.4% BELOW the same point in 2025. Fewer homes are coming to market, not more. What changed is the other end: of the homes that left agents' books in July, only 51.3% exchanged and completed. The rest, 49%, withdrew unsold, against a seven-year average exchange rate of 57.6%.
That is worth sitting with, because it inverts the usual reading. The market is not flooded with new stock. It is congested with old stock that will not clear. Every one of those withdrawals was an instruction somebody won, serviced for months and never got paid for.
Price competition is the visible symptom. The underlying condition is that property is no longer the scarce thing in this market. Attention is. Every instruction you take on is now competing against more rivals, for a buyer with more options than at any point in over a decade. How that enquiry is handled is now the whole of the difference, and we have set out why we answer on WhatsApp rather than any other channel.
The national number describes nobody
Rightmove's national average has 101,305 homes behind it, and an average that large can only mislead you one way: by flattening two markets moving in opposite directions into a single number that fits neither of them.
Prices in the north of England are up 1.5% on a year ago. Prices in the south of England are down 1.8%. The North West is the strongest region in Great Britain at +1.9% annually. London is the weakest at -3.1%, the biggest yearly fall of any part of the country. Scotland is up on last year, and the Midlands and Wales are only marginally down.
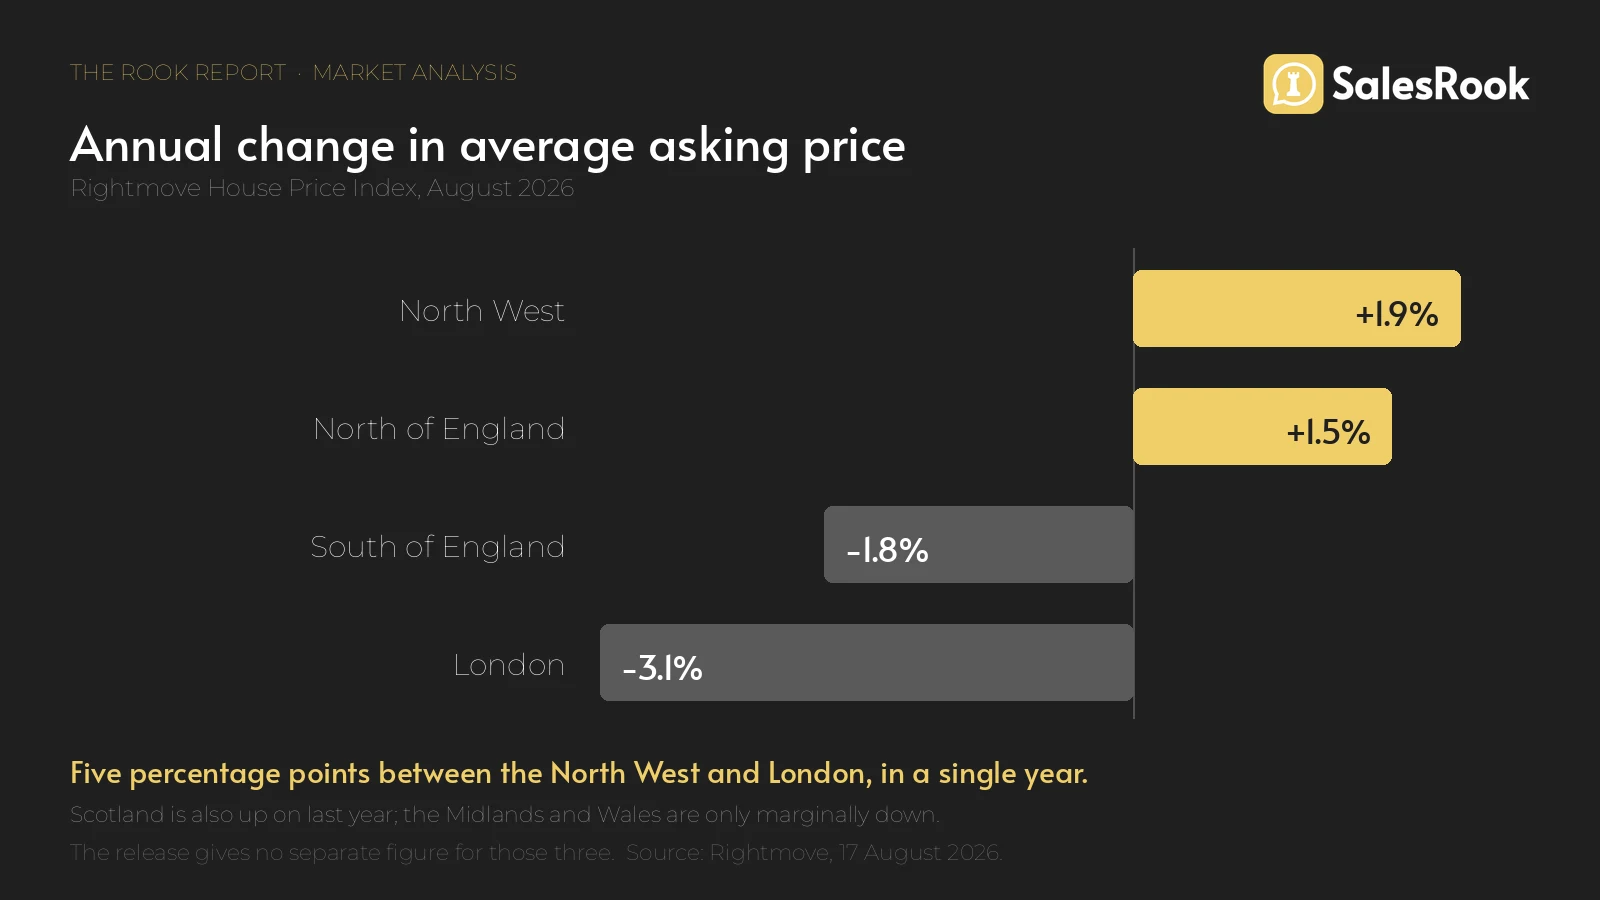
The gap between the North West and London is five percentage points in a single year. No valuation conversation in either place is improved by quoting a national figure that sits between them and describes neither.
National average prices are increasingly masking very different local market conditions. While asking prices across both northern England and Scotland continue to edge upwards, southern England is moving in the opposite direction, with London seeing the biggest annual price fall.
Colleen Babcock, property expert at Rightmove
London has a second problem stacked on the first. An average London home now costs around 17 times the national average annual wage, and is 38% more expensive than the South East, the next priciest region. High London prices are not new. High London prices combined with a two-year fixed rate of 5.09% and the most choice buyers have had since 2010 is a market that reprices.
Every rung moved, but not by the same amount
The fall was not evenly spread across the market either. First-time buyer homes held up best, down 0.3% in the month to £225,525. Second-stepper homes fell 1.3% to £341,807. The top of the ladder fell 2.8% to £667,056, more than nine times the first-time buyer move.
That is worth knowing before your next listing appointment. If you are valuing a large family home this week, the pricing pressure on that sector is real and it is documented. If you are valuing a first flat, quoting a headline 2.0% fall to a nervous seller overstates what happened to their kind of property by a factor of six.
Sellers are already adjusting, and that is the good news
It would be easy to read a 2.0% drop as bad news for agents. A market where sellers price realistically from day one is a market where instructions convert into completions, and a dip like this one separates agencies rather than sinking all of them, instead of sitting on your books for four months and then reducing anyway.
This month's larger-than-usual August price drop is a sign that many sellers are recognising the reality of the market and pricing much more competitively from day one. Buyers have the widest choice of homes for sale at this time of year in more than a decade, so standing out on price for the right reasons is hugely important.
Colleen Babcock, property expert at Rightmove
Buyer demand is up 5% since 20 July, though activity remains around 10% below the same point last year. Rightmove has also cut its own 2026 forecast, from growth of 2% to somewhere between 0% and -2% for the year, citing mortgage rates, the geopolitical picture and the new Chancellor's first Budget in October. Forecasts made in January rarely survive August.
The other announcement, eight days later
On 25 August, Homes England confirmed the first strategic partners for the £39 billion Social and Affordable Homes Programme, the largest investment of its kind in a generation. Individual providers were named with their allocations: Onward Homes 3,000 homes at £345.1 million, Midland Heart 1,820 at £225.1 million, Newcastle City Council 966 at £141.4 million.
Eight days separated that from the index. One is a ten-year building programme and the other is four weeks of asking prices, and nobody wrote either with the other in mind. But they are the two things a vendor has read about this month, and you will be asked about both.
Both also landed in the first six weeks of a new government. Andy Burnham became Prime Minister on 20 July, John Healey became Chancellor the same day, and the government says the Prime Minister will now work each week from a Manchester office called No10 North, in Heron House, complete with a black front door and a brass 10 on it.

Prime Minister Andy Burnham (third from left) and Chancellor John Healey (second from right) at No10 North, the government's Manchester office in Heron House, 24 July 2026. Picture by Lauren Hurley / No 10 Downing Street, used under the Open Government Licence v3.0.
The useful thing to hold is the difference in horizon. A ten-year programme says something about supply in 2032. The index says something about the last four weeks. When a vendor cites either at you as a reason to wait, that mismatch is the answer.
And the question every vendor is about to ask
The date is now fixed. Healey delivers his first Budget on Wednesday 28 October, and Rightmove names it among the reasons it will not forecast the rest of the year with confidence.
You would not guess a Budget was coming from the government's public mood. Three days into the job, Burnham and Healey were in the Hare in Harlow to announce a 20% cut in business rates for pubs, clubs and live music venues in England, worth an estimated £1,100 next year to a typical pub. The Prime Minister poured the Chancellor a pint.

The Prime Minister at the Hare in Harlow, 23 July 2026, the day the government announced its business rates cut for pubs. Picture by Simon Dawson / No 10 Downing Street, used under CC BY 4.0.
Then the two of them filmed themselves ranking pub snacks. The Week reported two million views across Instagram and TikTok, and Burnham has been dubbed the TikTok PM by a press corps that cannot agree on whether it is refreshing or a gimmick.
The Prime Minister and the Chancellor rank pub snacks, 24 July 2026. Video: Andy Burnham on YouTube.
Enjoy it, because none of it tells you what is in the Budget. Your vendors have worked out that one is coming, and every one of them is about to ask you the same question.
"Should we wait until after the Budget?"
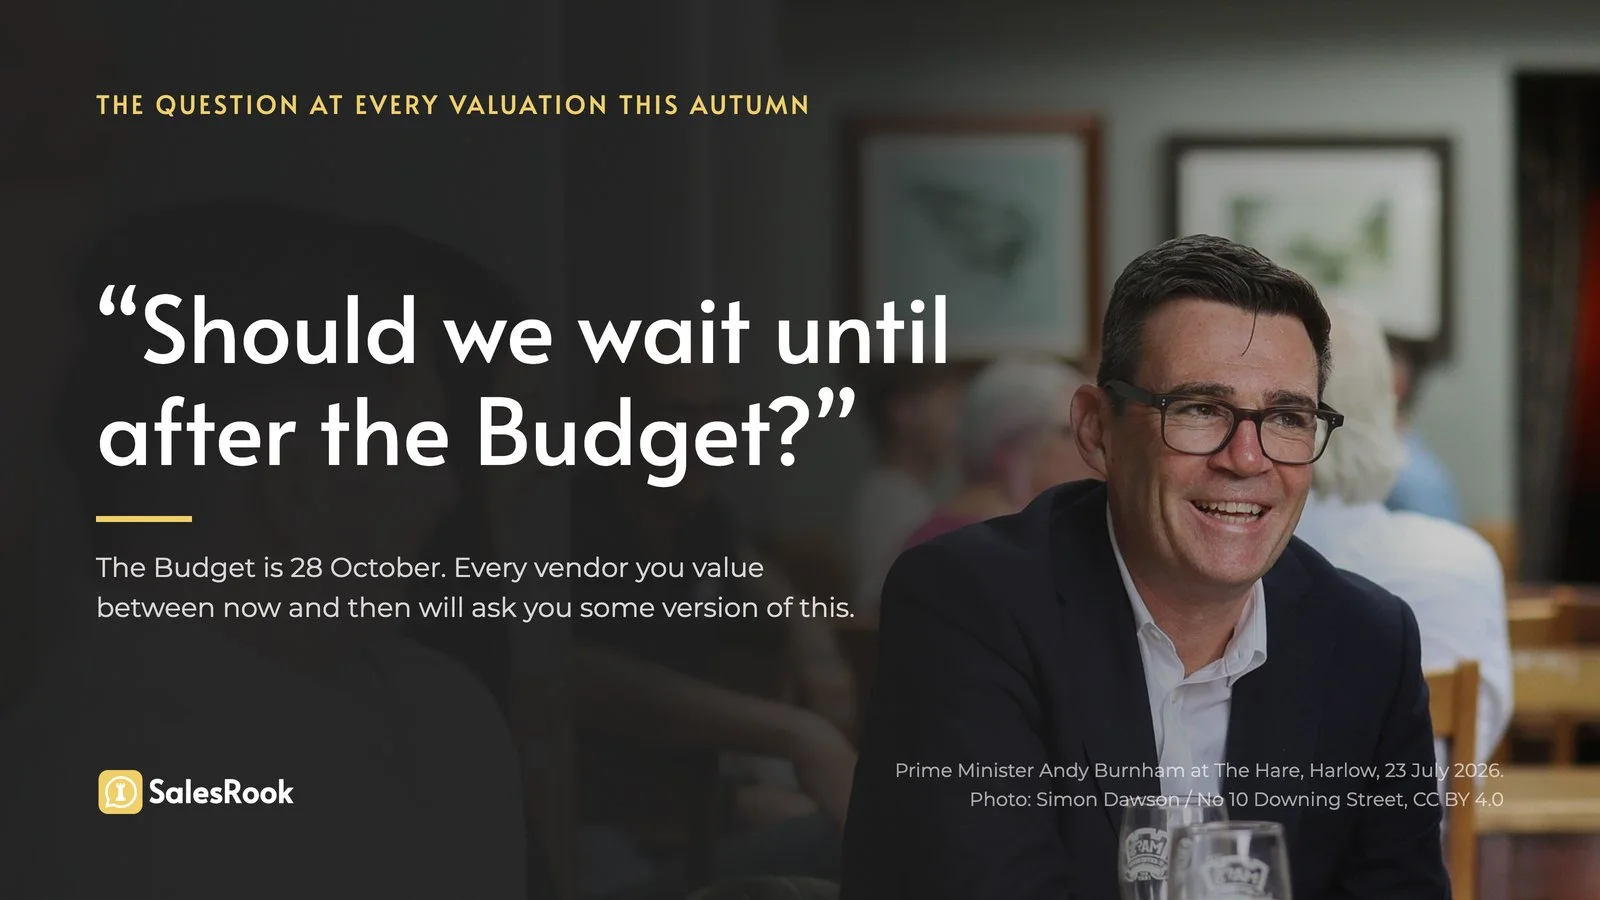
You will hear it at every valuation between now and the end of October, and some version of it in every reduction conversation too. It deserves a better answer than a shrug.
Start with the admission: nobody knows. Not you, not the vendor, and on its own evidence not Rightmove either, which cut its forecast for the year rather than defend it.
What you can tell them is what waiting costs, because that part is knowable. A vendor who waits until November launches into the tail of the year rather than the front of it, against competition that has already priced realistically, and into the widest buyer choice at this time of year in more than a decade.
And they will be launching alongside everybody else who waited.
The index has just measured, across 101,305 listings, what happens to sellers who open too high in a market with this much choice. That is not a forecast. It has already happened.
So what does a sharp agent actually do this week?
The index is a snapshot of what other people did. Here is what you can do with it before Friday.
- Stop quoting the national number. Pull your own region's annual change and take it to every valuation this week. If you are in the North West you are selling into the strongest region in Great Britain, and a seller reading national headlines does not know that. If you are in London you need the local number to have an honest conversation about price.
- Ask the second question at every valuation. A meaningful share of enquiries carry a seller hiding inside a buyer, and in a market this crowded that is the cheapest instruction you will win all month.
- Segment your pitch by rung. A 2.8% fall at the top of the ladder and a 0.3% fall at the bottom are different markets. Use the sector figure that matches the house you are standing in.
- Audit your stock against day-one pricing. Rightmove's own analysis says sellers who price realistically from the start are statistically more likely to find a buyer and complete. Every listing on your books that launched optimistically in June is now competing against a twelve-year high in supply.
- Then fix the thing the index cannot see. Every figure above describes supply. None of it describes what happens when a buyer, holding a shortlist of twelve, sends an enquiry about one of yours at nine o'clock on a Sunday night.
That last one is where the market has changed underneath the price data. Rightmove's own long-standing finding is that the busiest minute of the week on Britain's biggest property portal is 8.48pm on a Wednesday, an hour when almost no branch is staffed. When choice was tight, a Monday morning reply was survivable. With stock at a 12-year high it is a lost enquiry, because by then someone else has already answered.
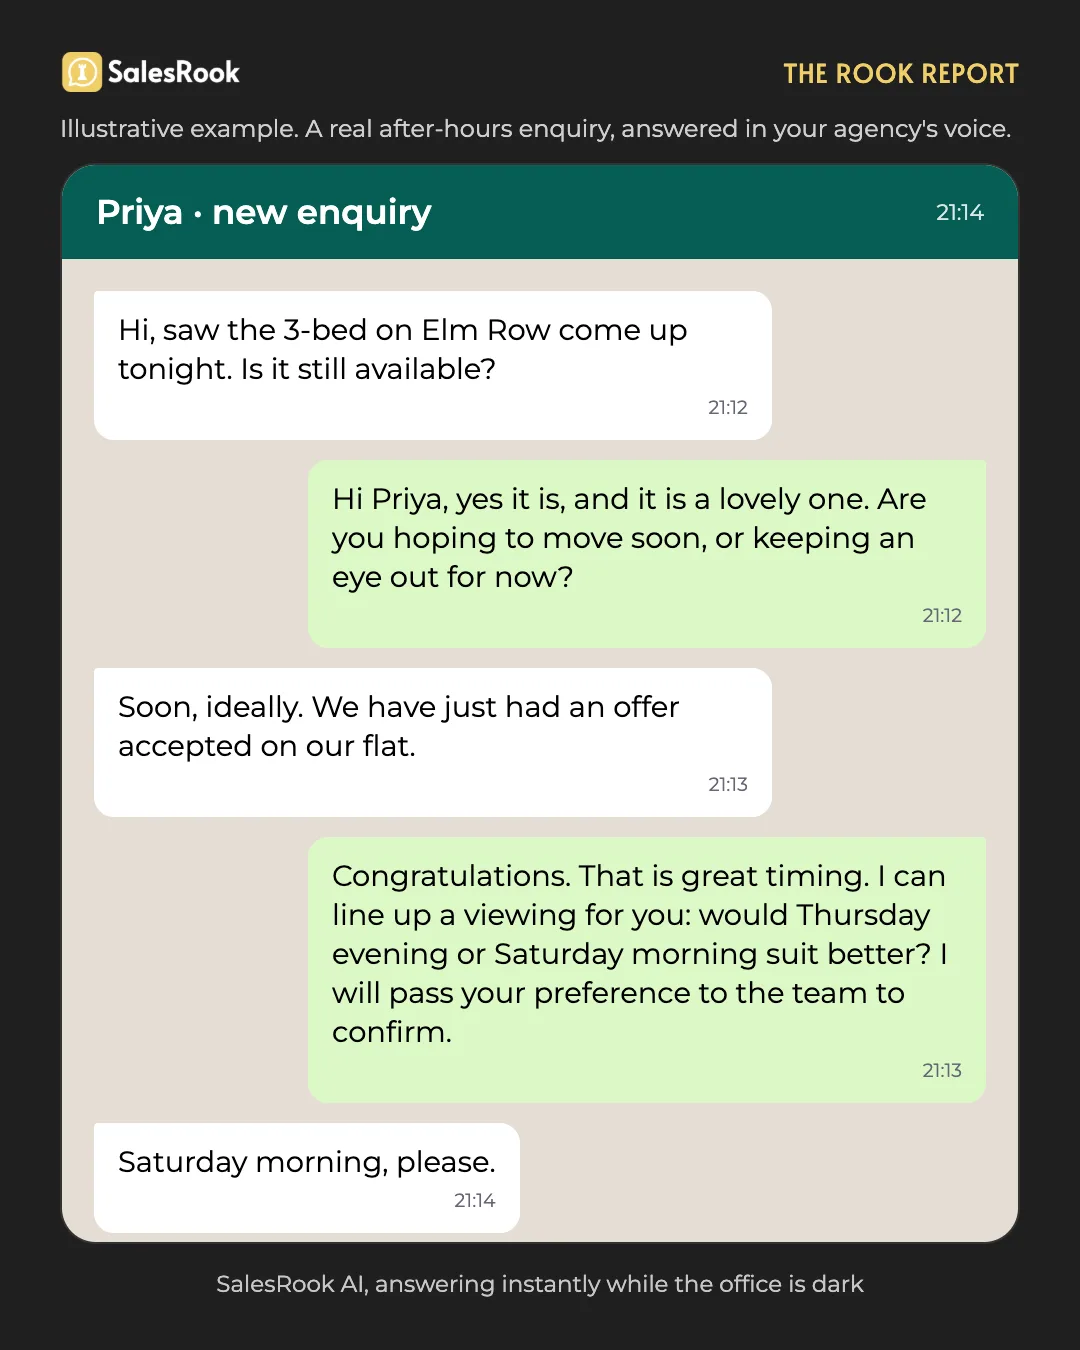
We have written at length about that specific gap in the after-hours enquiry, about the seller hiding inside a buyer enquiry in hidden valuations, and about why we answer on WhatsApp rather than by phone in why we did not build a voice AI. All three matter more in a high-supply market than they did in a tight one.
The month in one line
Asking prices fell 2.0% to £364,999, the sharpest August drop in eight years. Buyers have the most choice in twelve years. And the national average now hides a five point gap between the North West and London that makes it useless in a valuation conversation.
Here is the countable version, and it takes ten minutes. Open the enquiries that arrived on your listings between Friday evening and Sunday night. Count how many got a real answer, from a person, before Monday morning. Then look at how many of those became a viewing. That ratio is worth more to you this autumn than any national index, because it is the one number in this article that is entirely yours to change.
If that count comes back lower than you would like, that is the problem we work on.
Sources: Rightmove House Price Index, 17 August 2026, based on 101,305 asking prices listed between 12 July and 8 August 2026. Busiest moving day forecast: HomeOwners Alliance and reallymoving, August 2026. Photographs of the Prime Minister and the Chancellor by Simon Dawson and Lauren Hurley / No 10 Downing Street, via Wikimedia Commons: the Hare, Harlow, 23 July 2026 under CC BY 4.0; No10 North, Manchester, 24 July 2026 under the Open Government Licence v3.0.

Max Hardy
Co-Founder
Max Hardy is the Co-Founder of SalesRook, a leading provider of AI solutions for the property sector. With a background in technology and property, Max leads SalesRook's mission to transform how estate agents and mortgage brokers engage with leads through AI-powered WhatsApp automation.